Network-based solution, fully supporting B/S architecture;
Inheriting Web operation interface with brand-new UI style and interaction design;
The acquisition layer adopts an innovative communication mechanism to ensure communication stability, data security and real-time performance, and can bear higher concurrency;
Highly professional design with comprehensive content, clear business processes and easy-to-learn operation procedures;
Functional modules feature strong usability and expansibility, with closely connected system architecture;
Multiple alternative data synchronization technologies, compatible with RS485, M-BUS and other wired communication methods, supporting Modbus, BACnet, TCP/IP and other communication protocols, and adaptable to various intelligent network instruments, ensuring high system flexibility;
Standardized system interfaces with free API documentation provided, enabling third-party systems to achieve data docking through standard API interfaces;
Customizable functional modules according to requirements, with simple and easy system upgrade and maintenance;
Customizable alarm rules: An independent alarm rule management interface is provided. Alarm rules for devices can be set for a specific meter, and users can customize alarm rules based on actual conditions.
Product design complies with the "Technical Guidelines for Sub-item Energy Consumption Data Collection of Energy Consumption Monitoring Systems for Office Buildings of State Organs and Large Public Buildings" and the "Technical Guidelines for Sub-item Energy Consumption Data Transmission of Energy Consumption Monitoring Systems for Office Buildings of State Organs and Large Public Buildings", with some parameter indicators exceeding the requirements of the above national standards;
Stable product communication, ensuring reliable transmission of large volumes of data;
Convenient product installation and maintenance: One-click installation of the installation package, and the operation and maintenance system shares the same platform with the user system;
Higher cost performance of the product.
Ⅱ. System Architecture
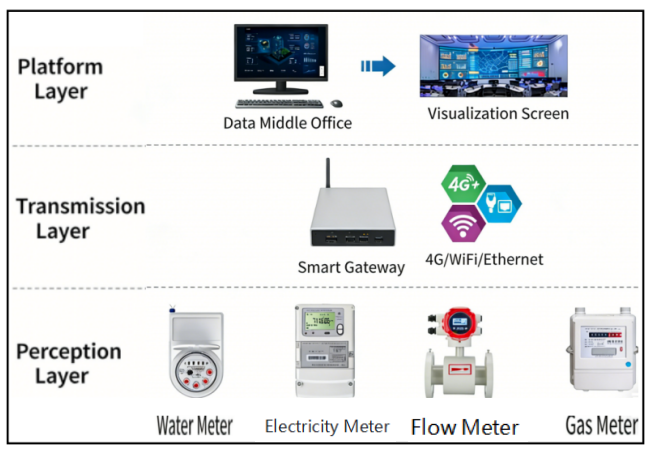
Dynamic display of building energy consumption KPIs: Real-time presentation of key indicators such as energy consumption statistics across all dimensions and peak-valley-flat electricity consumption, helping managers grasp the building's energy consumption status.
Dynamic display of energy consumption comparison across all dimensions: Visualization of energy consumption comparisons between different locations, devices and time periods via charts, assisting managers in optimizing issues like energy consumption distribution.
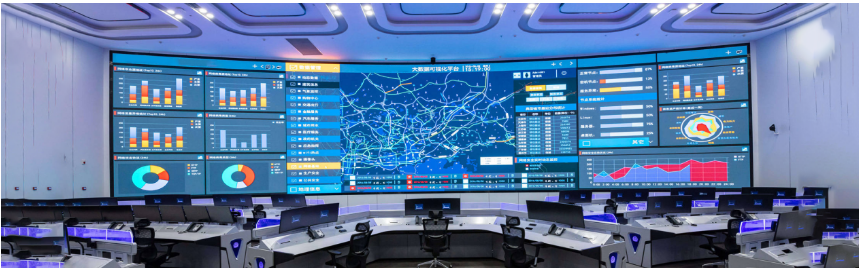
Real-time monitoring of device acquisition status: Real-time tracking of the acquisition status and live data of devices such as smart electricity meters and water meters to ensure data accuracy. Historical data query is also supported.
Real-time monitoring of gateway online status: Real-time supervision of gateway connectivity to guarantee stable data transmission. It also supports querying historical online/offline records of gateways and devices, facilitating troubleshooting of past issues.
Data calculation: Complex result calculations can be achieved by binding data points and coefficients to formulas. Formulas can be linked to virtual device points and consumption allocation operations to implement sophisticated business functions.
Multi-dimensional statistics: Consumption data is statistically displayed based on classification by device, location, sub-item and group across different time dimensions (daily, weekly, monthly, quarterly, annual). It also supports meter reading statistics for user-defined time periods, time-sharing statistics (peak, shoulder, off-peak, flat) and custom-designed reports in Excel format.
YoY/ QoQ data analysis: Charts of consumption volume and ratio comparisons (Year-on-Year/Quarter-on-Quarter) are displayed based on screening results across different dimensions.
Configuration: Data visualization interfaces can be freely designed through drag-and-drop operations and predefined templates. Real-time data display and control are achievable by binding data points. It can also be integrated with the Intelligent Computing Engine module to realize real-time presentation of complex data results. This eliminates the monotony and rigidity of data display styles and types.
Threshold-based alerting: Set energy consumption thresholds. The system automatically triggers alerts when energy consumption exceeds limits, data changes abnormally, or devices go offline. It supports message notifications and alert record review.
Virtual Devices: In energy metering scenarios, a single meter may serve multiple measurement objects. The system allows creating virtual devices, binding them to consumption allocation calculation points to form virtual metering units. It also supports binding time-sharing points to construct peak/shoulder/off-peak/flat time-sharing metering points.